More on Gaussian Process Surrogate Models
Gaussian Process (GP) surrogate models can be used in a way that is similar to Deep Neural Network (DNN) surrogate models. In addition, GP surrogate models play an important part when using the Uncertainty Quantification Module, an add-on to the COMSOL Multiphysics® software. For more information on GP surrogate models, see our resources that cover Creating a Multiphysics-Driven Gaussian Process Surrogate Model and provide an overview of the Uncertainty Quantification Module. Here, we discuss Gaussian process regression, or GP regression, and the theory behind it in greater detail.
Brief Summary of Gaussian Process Regression
When performing GP regression, we assume that the function we want to predict, or approximate, is continuous with a certain level of smoothness. For instance, this function might be defined by the solution to a finite element model. Additionally, we assume that the function's values at different points are correlated; points closer together are more similar. This assumption holds true in cases such as heat transfer models, where temperature varies predictably between neighboring points. Similarly, the total heat power of a model varies continuously when the temperature at a boundary is smoothly adjusted. Generally, we have a set of observed, or measured, data points where
is the value of the function at
. The objective of GP regression is now to predict the value
of the function at a new point
where we don't have an observation.
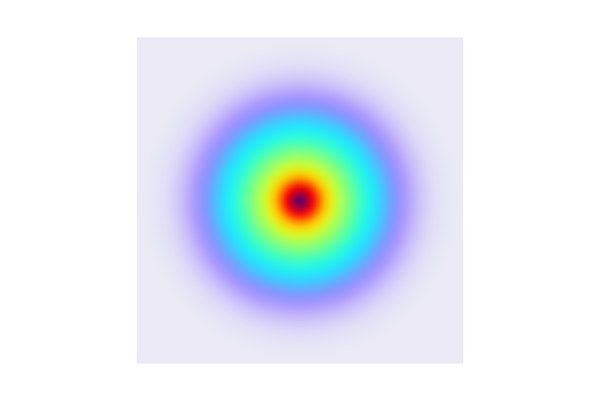
The covariance function (or kernel) describes how the function values at different points are correlated. A common choice is the squared exponential (or Gaussian) kernel, which states that points closer together are more strongly correlated:
Another common name for this kernel is radial basis function kernel, or RBF kernel.
Here, is a length scale parameter that controls how quickly the correlation decreases with distance. The COMSOL® implementation lets you choose among a few different covariance functions, explained later in the course. The parameter
is called the signal variance and is used to scale the covariance function. Intuitively, if we consider a case where the function we would like to fit is a 1D function
, the length scale and signal variance control the scaling in the x- and y-direction, respectively.
By introducing a distance variable, we can write this as:
where
is the distance between points.
In addition to a covariance function, GP regression also assumes that the function we want to predict has a certain mean value. This mean value can take various forms depending on the assumptions or prior knowledge about the function, for example, constant mean, linear mean, or quadratic polynomial mean. In many practical applications, the mean value is assumed to be constant. This simplifies the computations and focuses the modeling on the covariance structure, which captures the dependencies and variations around this mean.
After GP regression has been performed, the actual mean value of the predicted function is not a constant but rather a combination of the prior mean and the data-driven adjustments.
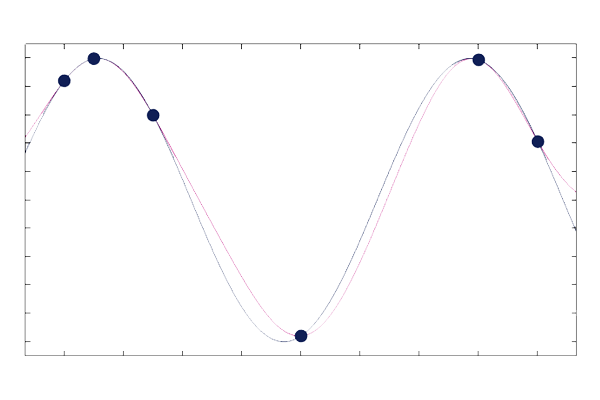
The three plots below show Gaussian process surrogate models (posterior mean functions) used to fit a curve through six points. The plots show the resulting fit for three different length scales: ,
, and
. The built-in GP surrogate model functionality automatically optimizes the length scale and the signal variance to find the best fit according to certain likelihood criteria.

A GP regression model with .

A GP regression model with .

A GP regression model with .
The plots show that a lower value of the length scale allows the fitted function to have faster variations (overfitting), whereas a higher value of the length scale results in a "stiffer" function fit with less flexibility (underfitting).
Prior Mean Function
Before observing any data, the GP regression model assumes a prior mean function. If this is a constant, it means that without any data, the best guess for any function value is this constant mean. In practice, the assumed prior mean only affects the prediction far away from observed, or measured, points where the predicted function returns to the prior mean function due to a lack of observed data points. If we assume a constant prior mean, we can easily subtract the sample mean from the observed data points before starting the regression process. Without loss of generality, we can therefore assume a zero prior mean function for the regression calculations.
Posterior Mean Function
Once data is observed, the model updates its predictions based on both the prior mean and the observed data. The posterior mean function represents the updated beliefs about the function values after taking into account the data.
The posterior mean at any point is given by:
where is the vector of covariances between the new point
and the observed points.
is the covariance matrix of the observed points, and
is the vector of known observed values.
Each entry of the covariance matrix is expressed in terms of observed points and has the form:
Or, for the squared exponential kernel specifically:
Each entry of the covariances vector is expressed in terms of the new points vs. an observed point:
Again, for the squared exponential kernel specifically:
By considering the covariance vector at an arbitrary point we get the posterior mean function:
The posterior mean function defines the function fitted by the GP regression process and is what constitutes the core of a GP surrogate model. The other part of a GP surrogate model is the uncertainty prediction.
The length scale and signal variance parameters are collectively called hyperparameters. In the COMSOL® implementation of GP regression, the values for the hyperparameters are automatically computed through an optimization process.
The fact that the covariance matrix needs to be inverted limits the number of data points that can be used in practice for GP regression and creating a GP surrogate model. This is why the surrogate model training has a default limit of 2000 data points.
Similarity to Radial Basis Function Fitting
GP regression is similar to radial basis function (RBF) fitting. In RBF fitting, we assume that the function we would like to fit is a weighted sum of radial basis functions:
Or, to make the notation more similar to that of GP regression:
where
is a radial basis function centered at , and
is a weight.
To determine the weights , we require the fitted function to match the observed data points:
This leads to a system of linear equations:
Or, in matrix form:
We can solve for the weights:
and use them to construct the fitted function.
By comparing with the GP regression expression:
we see that the weights correspond to
In a practical implementation of GP regression, there are additional contributions from noise, which is added to the covariance matrix. RBF fitting and GP regression are equivalent in the case of noiseless data and when the RBF is used as the kernel function. For an example of RBF fitting, see our blog post on Using Radial Basis Functions for Surface Interpolation.
Uncertainty Estimate
The theory behind GP regression also lets us compute the predicted variance (uncertainty) at the new point
. It is given by:

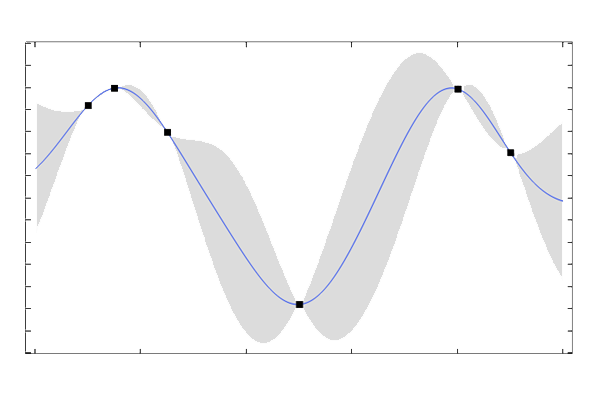
The variance around a GP regression mean function, expressed as one standard deviation.
This uncertainty estimate has its roots in the theoretical foundation of GP regression. The variance of the surrogate model can be analytically computed when the regression process is viewed as a conditional probability distribution function from a multivariate Gaussian (normal) distribution, or rather, Gaussian process. A Gaussian process is a generalization of the Gaussian (or normal) distribution to functions and can be thought of as an infinite collection of random variables, any finite number of which have a joint Gaussian distribution. This will be covered in more detail in the next course part, More on Gaussian Processes. In practice, when performing these computations, an additional noise term is added to the covariance matrix. This adds numerical stability as well as the possibility to model noisy data.
Envoyer des commentaires sur cette page ou contacter le support ici.


