More on PCE Surrogate Models, Sensitivity Analysis, and Sobol Indices
Continuing the discussion on Polynomial Chaos Expansion (PCE) surrogate models from Part 9, we will now learn more about how Sobol indices used for sensitivity analysis are computed based on a PCE surrogate model.
Sobol Indices
The Sobol indices can be computed in other ways, but using a PCE surrogate model offers a straightforward approach to obtaining the indices by using the orthogonal properties of the polynomial basis functions. This method allows for the direct computation of the variance contributions from each input parameter and their interactions. We will continue to make things more concrete by using the Ishigami function part of a course that provides an introduction to surrogate modeling as an example. Recall that the Ishigami function is commonly used for global sensitivity benchmarking. It is a random function of three variables, for which the mean, standard deviation, maximum, minimum values, and Sobol indices can be calculated analytically. The Ishigami function is:

where  ,
,  , and
, and  are independent uniformly distributed random variables in
  ,
,  , and
, and  .
.
Sobol indices are used in global sensitivity analysis to measure the contribution of each input parameter to the overall variance of the output. These indices help identify which input parameters significantly impact the function's behavior. For instance, Sobol indices can be used to narrow down the number of input parameters considered in a more detailed uncertainty quantification analysis. Sobol indices as well as variance can be more or less directly computed from the coefficient of the PCE.
Recall, the form of a PCE using multi-index notation is:

which, for the truncated expansion, takes the form:

where  and
and  and
and  is the maximum total polynomial degree that we would like to include.
The total degree of a multi-index is defined as:

A truncated PC expansion for a function of three variables, like the Ishigami function, using Legendre polynomials and uniform distribution for all variables on , can be represented as follows:

where we only include those terms for which  .
.
We can assume here that the polynomials are orthonormal and rescaled to the interval  . Rescaling the input variables does not affect the Sobol indices because Sobol indices are dimensionless and measure the relative contributions of each input parameter to the output variance for the quantities of interest.
First-Order Sobol Indices
The first-order Sobol index  measures the contribution of a single input parameter
  to the (output) variance for the quantity of interest. This index requires first computing the first-order effect and then divide, or normalize, by the total variance.
The first-order effect measures the unnormalized contribution of an individual input parameter to the variance of the output while keeping all other input parameters fixed. It captures the main effect of the input parameter on the output without considering interactions with other parameters.
The mathematical definition of first-order effect is:

where

is the conditional expectation of  given .
Using a PC expansion, the first-order effect for the input parameter can be shown to be given by the sum of the squared PCE coefficients corresponding to terms that involve only :

For a truncated first-order effect, we can use the notation:

In the case of a function of three variables, the first-order effect for is:

The total variance in the context of sensitivity analysis represents the overall uncertainty or variability in the model output due to the variability in all input parameters. The total variance is computed from the PCE coefficients as:

For example, in the case of a function of three variables, the total variance is:

The first-order Sobol index is the ratio of the first-order effect to the total variance:

When using a PCE surrogate model in practice, the expansion is truncated and the approximate first-order Sobol index is:

For example, in the case of a function of three variables, the first-order Sobol index for is:

Total Sobol Indices
The total Sobol index  measures the overall contribution of an input parameter to the output variance of a quantity of interest, including both its individual effects and its interactions with all other input variables. It is a composite sensitivity measure that accounts for the complete influence of a particular input parameter on the output. This index is computed by first calculating the total effect variance of the input parameter and then normalizing it by the total variance of the output.
The total effect  is the unnormalized variance of the output that can be attributed to , including both the individual effect of and its interactions with other input variables.
In terms of a PCE, the total effect can be written as a sum of squared PCE coefficients over all terms where is present, regardless of whether any of the  are also present:

For a truncated total effect, we can use the notation:

For example, in the case of a function of three variables, like the Ishigami function, the total effect for is:

which includes all terms where is present, regardless of whether any of the or are also present.
The total Sobol index is the ratio of the total effect to the total variance:

When using a PCE surrogate model in practice, the expansion is truncated and the approximate total Sobol index is:

For example, in the case of a function of three variables, the total Sobol index for is:

In Part 7 of the course providing an introduction to surrogate modeling in COMSOL Multiphysics®, the Sobol indices were computed for the Ishigami function using an Uncertainty Quantification study with the Sensitivity Analysis option. The default plot when using this option is a Sobol Index plot, which shows the first-order and total Sobol indices for each parameter in a bar graph, as shown in the figure below. For each parameter, the first-order index is to the left and the total index is to the right.
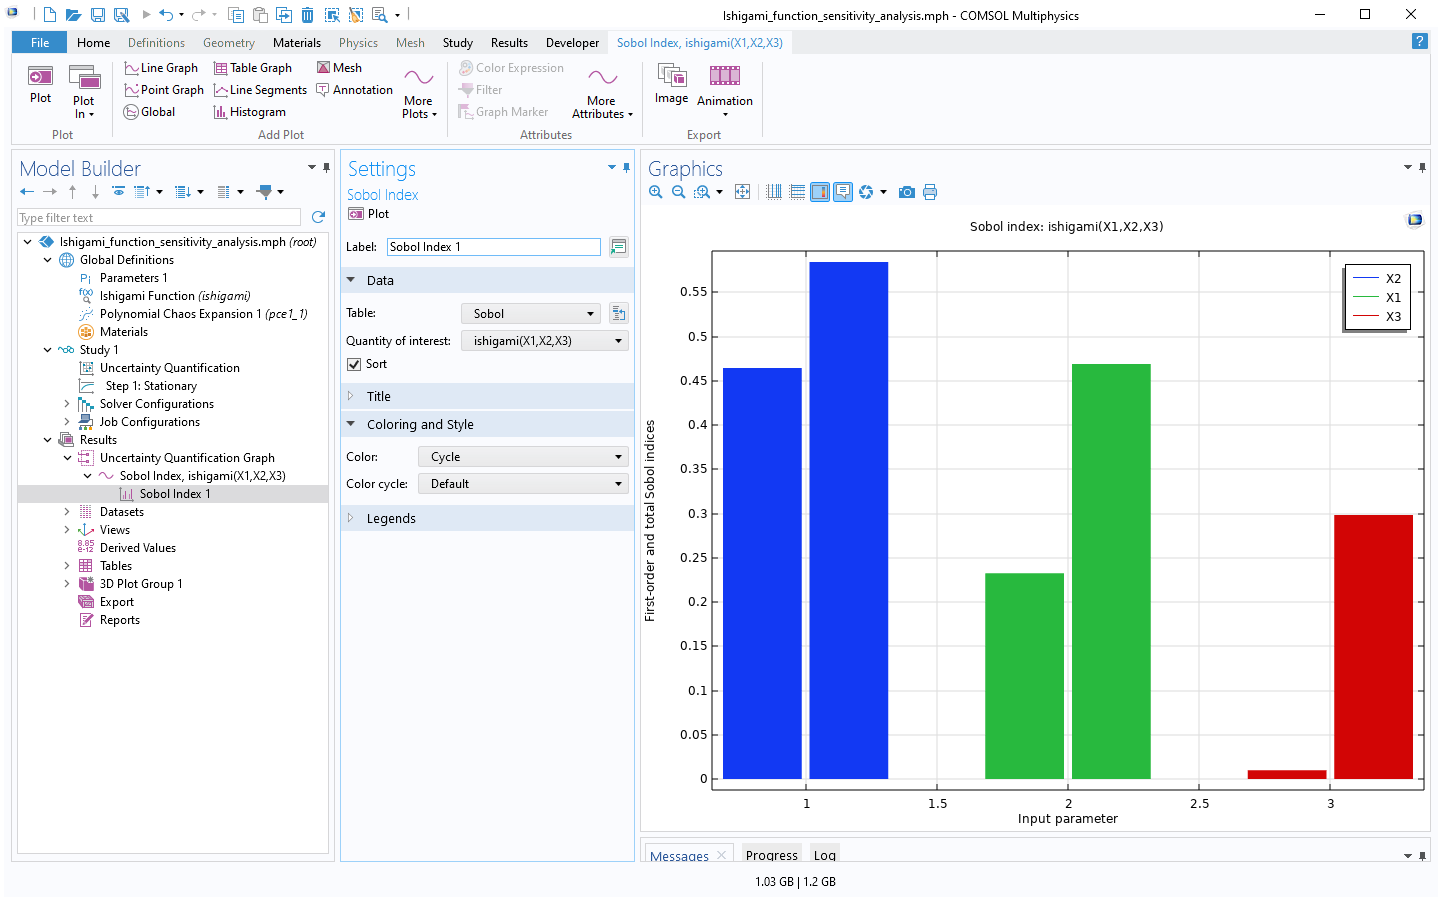 The Model Builder with the Sobel Index plot node selected and the corresponding Settings window and Graphics window shown.
The Sobol Index plot for the Ishigami function.
The Model Builder with the Sobel Index plot node selected and the corresponding Settings window and Graphics window shown.
The Sobol Index plot for the Ishigami function.
For the parameter , we can see that both the first-order and total Sobol indices are relatively significant. The first-order Sobol index indicates a substantial direct contribution of to the output variance. The total Sobol index suggests that has a significant impact on the output, both directly and through interactions. The conclusions for are similar.
For the parameter , the relatively small value of the first-order index indicates it does not have any (or nearly any) direct contribution to the output variance. However, the relatively higher value of the total Sobol index implies that contributes significantly to the output variance through interactions with other variables. This can also be seen directly from the expression for the Ishigami function:
Here, and occur in their own terms, whereas only occurs in an interaction term with .
Envoyer des commentaires sur cette page ou contacter le support ici.